The Intervention App, located inside the SafeWork Dashboard, is designed to help managers discover actionable insights on how they can help their team work safer.
The Intervention App brings data on leading risk factors, sensor usage, participation, and daily Safety Scores for specific individuals, shifts and job types into a single view.
-
Open the App
Navigate to the SafeWork Dashboard and open the Intervention App by clicking the Intervention App link in the navigation sidebar on the left-hand side of the Dashboard.
-
Filter Your Data
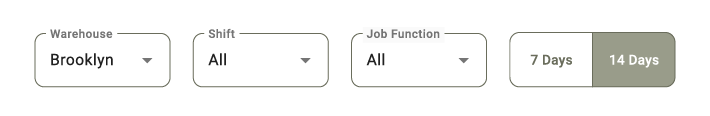
Inside the Intervention App, you’ll see a row of filter options at the top of the screen. These filters can be used to load data for specific warehouses, shifts, and job functions. You may also select whether to display data for the last 7 or 14 day periods.
-
Understanding the Data
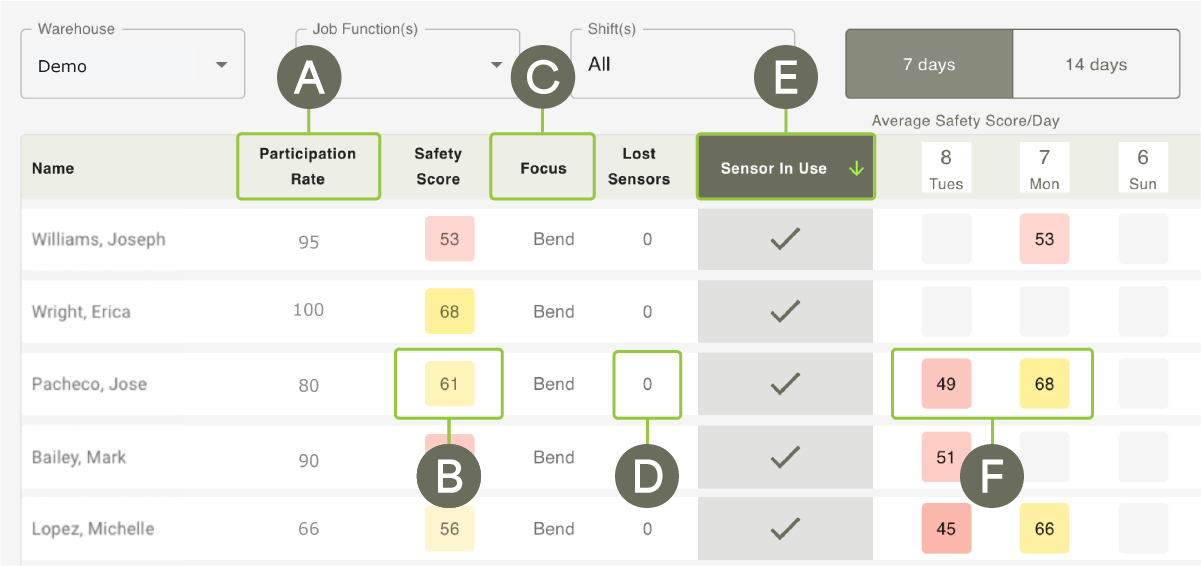
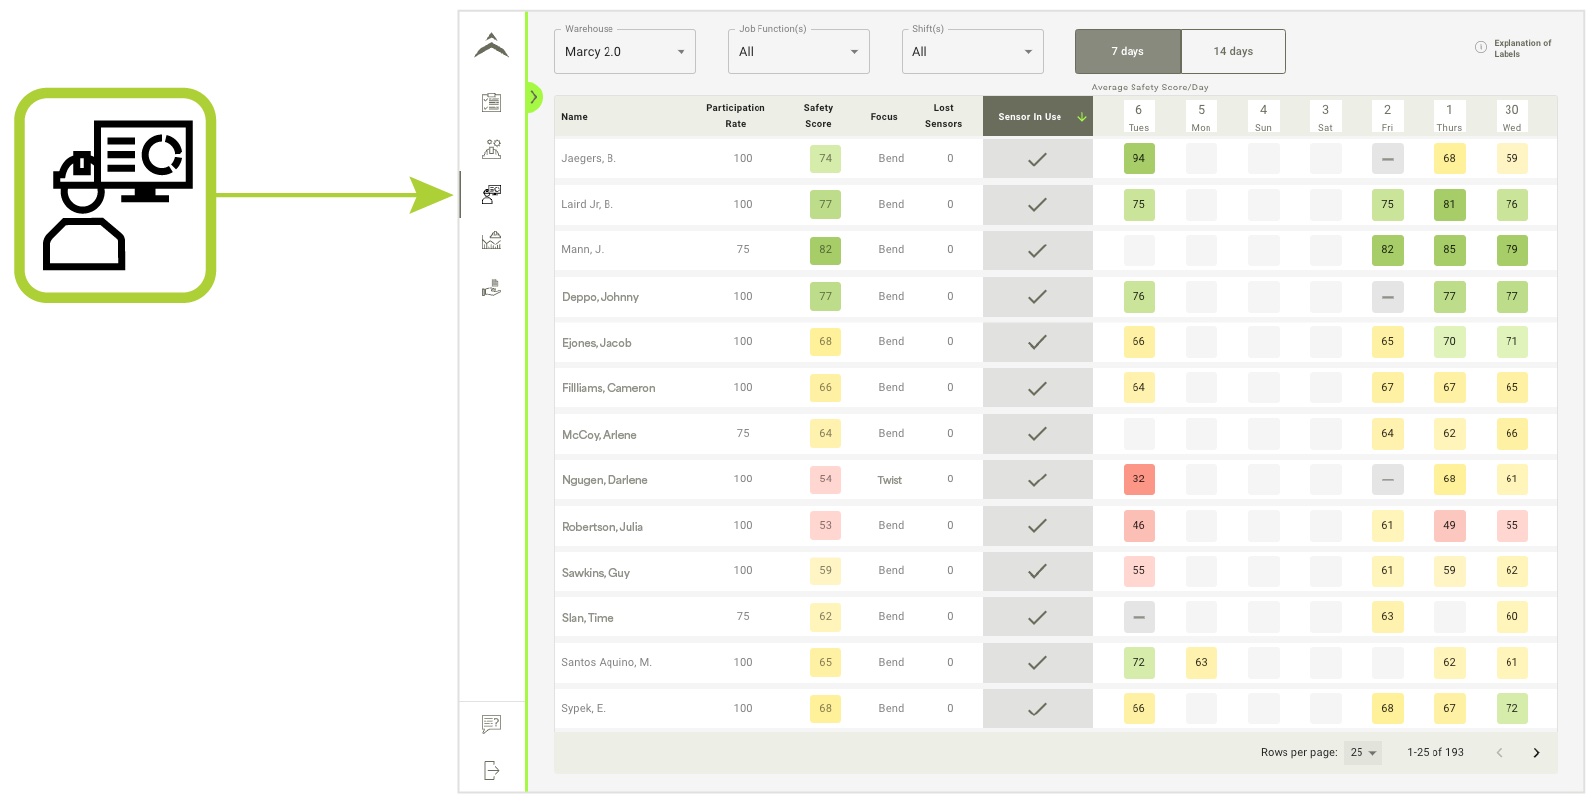
Each row in the Intervention App displays information about a single Industrial Athlete with key metrics on how the Athlete is performing in the SafeWork Program.
Figure 1. Overview of Information Available in the Intervention App
-
Participation Rate
Number of times a sensor was checked out / number of shifts the Athlete was scheduled to work.
-
Safety Score
The Athlete’s overall average Safety Score for the current time period (7 or 14 days).
-
Focus
The Risk Factor detracting most from the Athlete’s overall Safety Score.
-
Lost Sensors
The number of sensors assigned to the Athlete that have been reported as missing during the current time period (7 or 14 days).
-
Sensor In Use
Does the Athlete currently have a Sensor in use?
-
Average Safety Score / Day
The Athlete’s average Safety Score for each day of the current time period (7 or 14 days).
For a more detailed description of the data available in the Intervention App, See: A Closer Look at Intervention App Metrics.
-
-
Using the Data
The Intervention App allows managers to quickly understand how their team is performing with the SafeWork System and provides actionable insights that can be shared with Industrial Athletes.
Participation Rate is determined by counting the number of times an Industrial Athlete checked out a sensor and dividing that number by the number of shifts the Athlete was scheduled to work.
For example, if an Athlete checks out a sensor 4 times during a 7 day period, and was scheduled to work 5 shifts during that period, their participation rate would be calculated as 80%.
In some cases, an Athlete’s Participation Rate may appear above 100%. This can occur if an Athlete works more than their scheduled number of shifts and checks out sensors during those shifts.
Clicking on the Participation Rate column header will sort the column from lowest to highest. This allows managers to quickly see which athletes have had little or no participation in the last 7 or 14 days.
Note
Low participation rates can sometimes be attributed to leaves of absence, temporary assignment changes, or a recent termination.
The Safety Score column displays the current 7 or 14 day average Safety Score for each Athlete.
Clicking on the Safety Score column header will sort the column from lowest to highest.
Note
Managers can utilize average Safety Scores to identify the highest and lowest individual performers in their SafeWork Program.
The information in the Focus column represents the Risk Factor (Bend, Twist, or Tilt) that is currently detracting the most from the Athlete’s overall Safety Score.
Managers can use this information to prioritize how they talk to Athletes about improving their individual Safety Score.
Note
The Focus column will be empty if the Athlete has had no participation during the current time period.
The Sensor In Use column provides real-time data about whether an Athlete has checked out and is currently using a Sensor. A Sensor must have been checked out in the last 24 hours to be considered “In Use.” If the Athlete does not return the sensor within 24 hours of checking it out, the Sensor will no longer be considered “In Use” and will now be reported as missing.
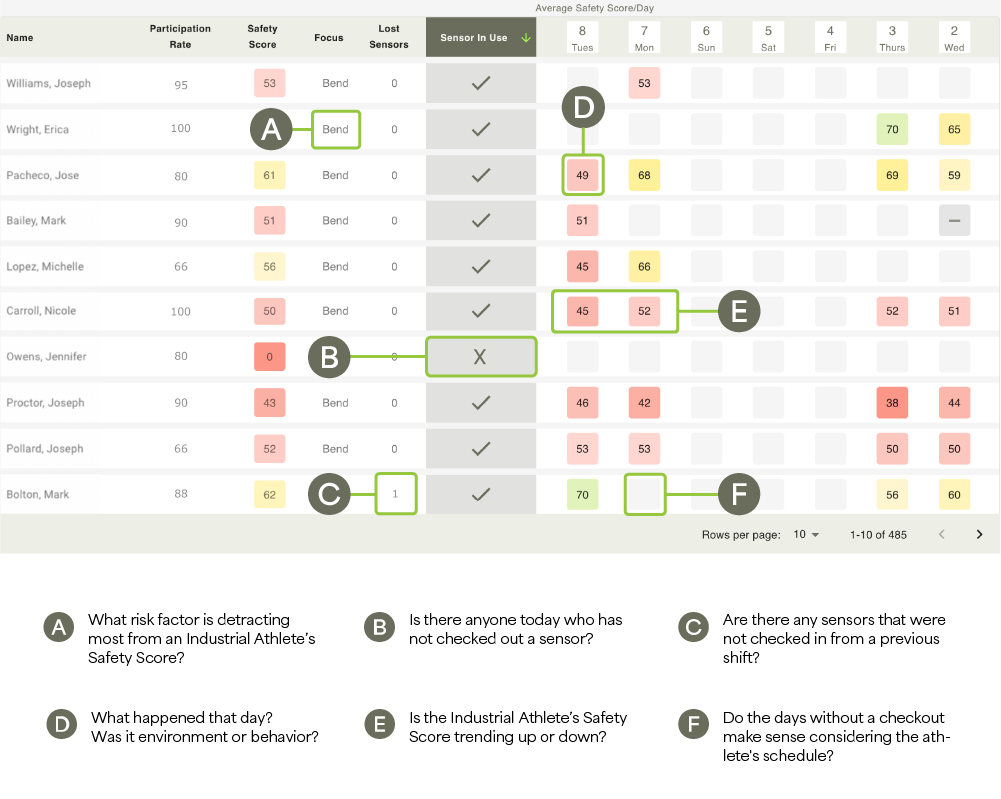
The Average Safety Score section shows an Athlete’s average Safety Score for each day of the current 7 or 14 day period.
Figure 2. Safety Score in the Intervention App
Safety Score values are color coded to help you visualize the level of injury risk associated with the score. High risk scores have a red background, moderate risk scores have a yellow background, and low risk scores have a green background.
 |
Green = Low Risk Scores in green boxes mean the Athlete has an overall low ergonomic risk. |
 |
Yellow = Moderate Risk Scores in yellow boxes mean the athlete has an overall moderate ergonomic risk. |
 |
Red = High Risk Scores in red boxes mean the athlete has an overall high ergonomic risk and needs guidance. |
 |
Incomplete Data A Sensor was checked out, but there was an insufficient amount of data recorded. |
In some instances, an Athlete can check out a sensor, but a Safety Score can not be determined due to incomplete data. If this happens the Safety Score value will be replaced with a dash and the background will be gray.
Incomplete data can occur if the sensor is not working properly, the sensor is not returned, the sensor is worn incorrectly, or the Athlete does not wear the sensor for a long enough period of time.
Athlete Profile Within The Intervention App
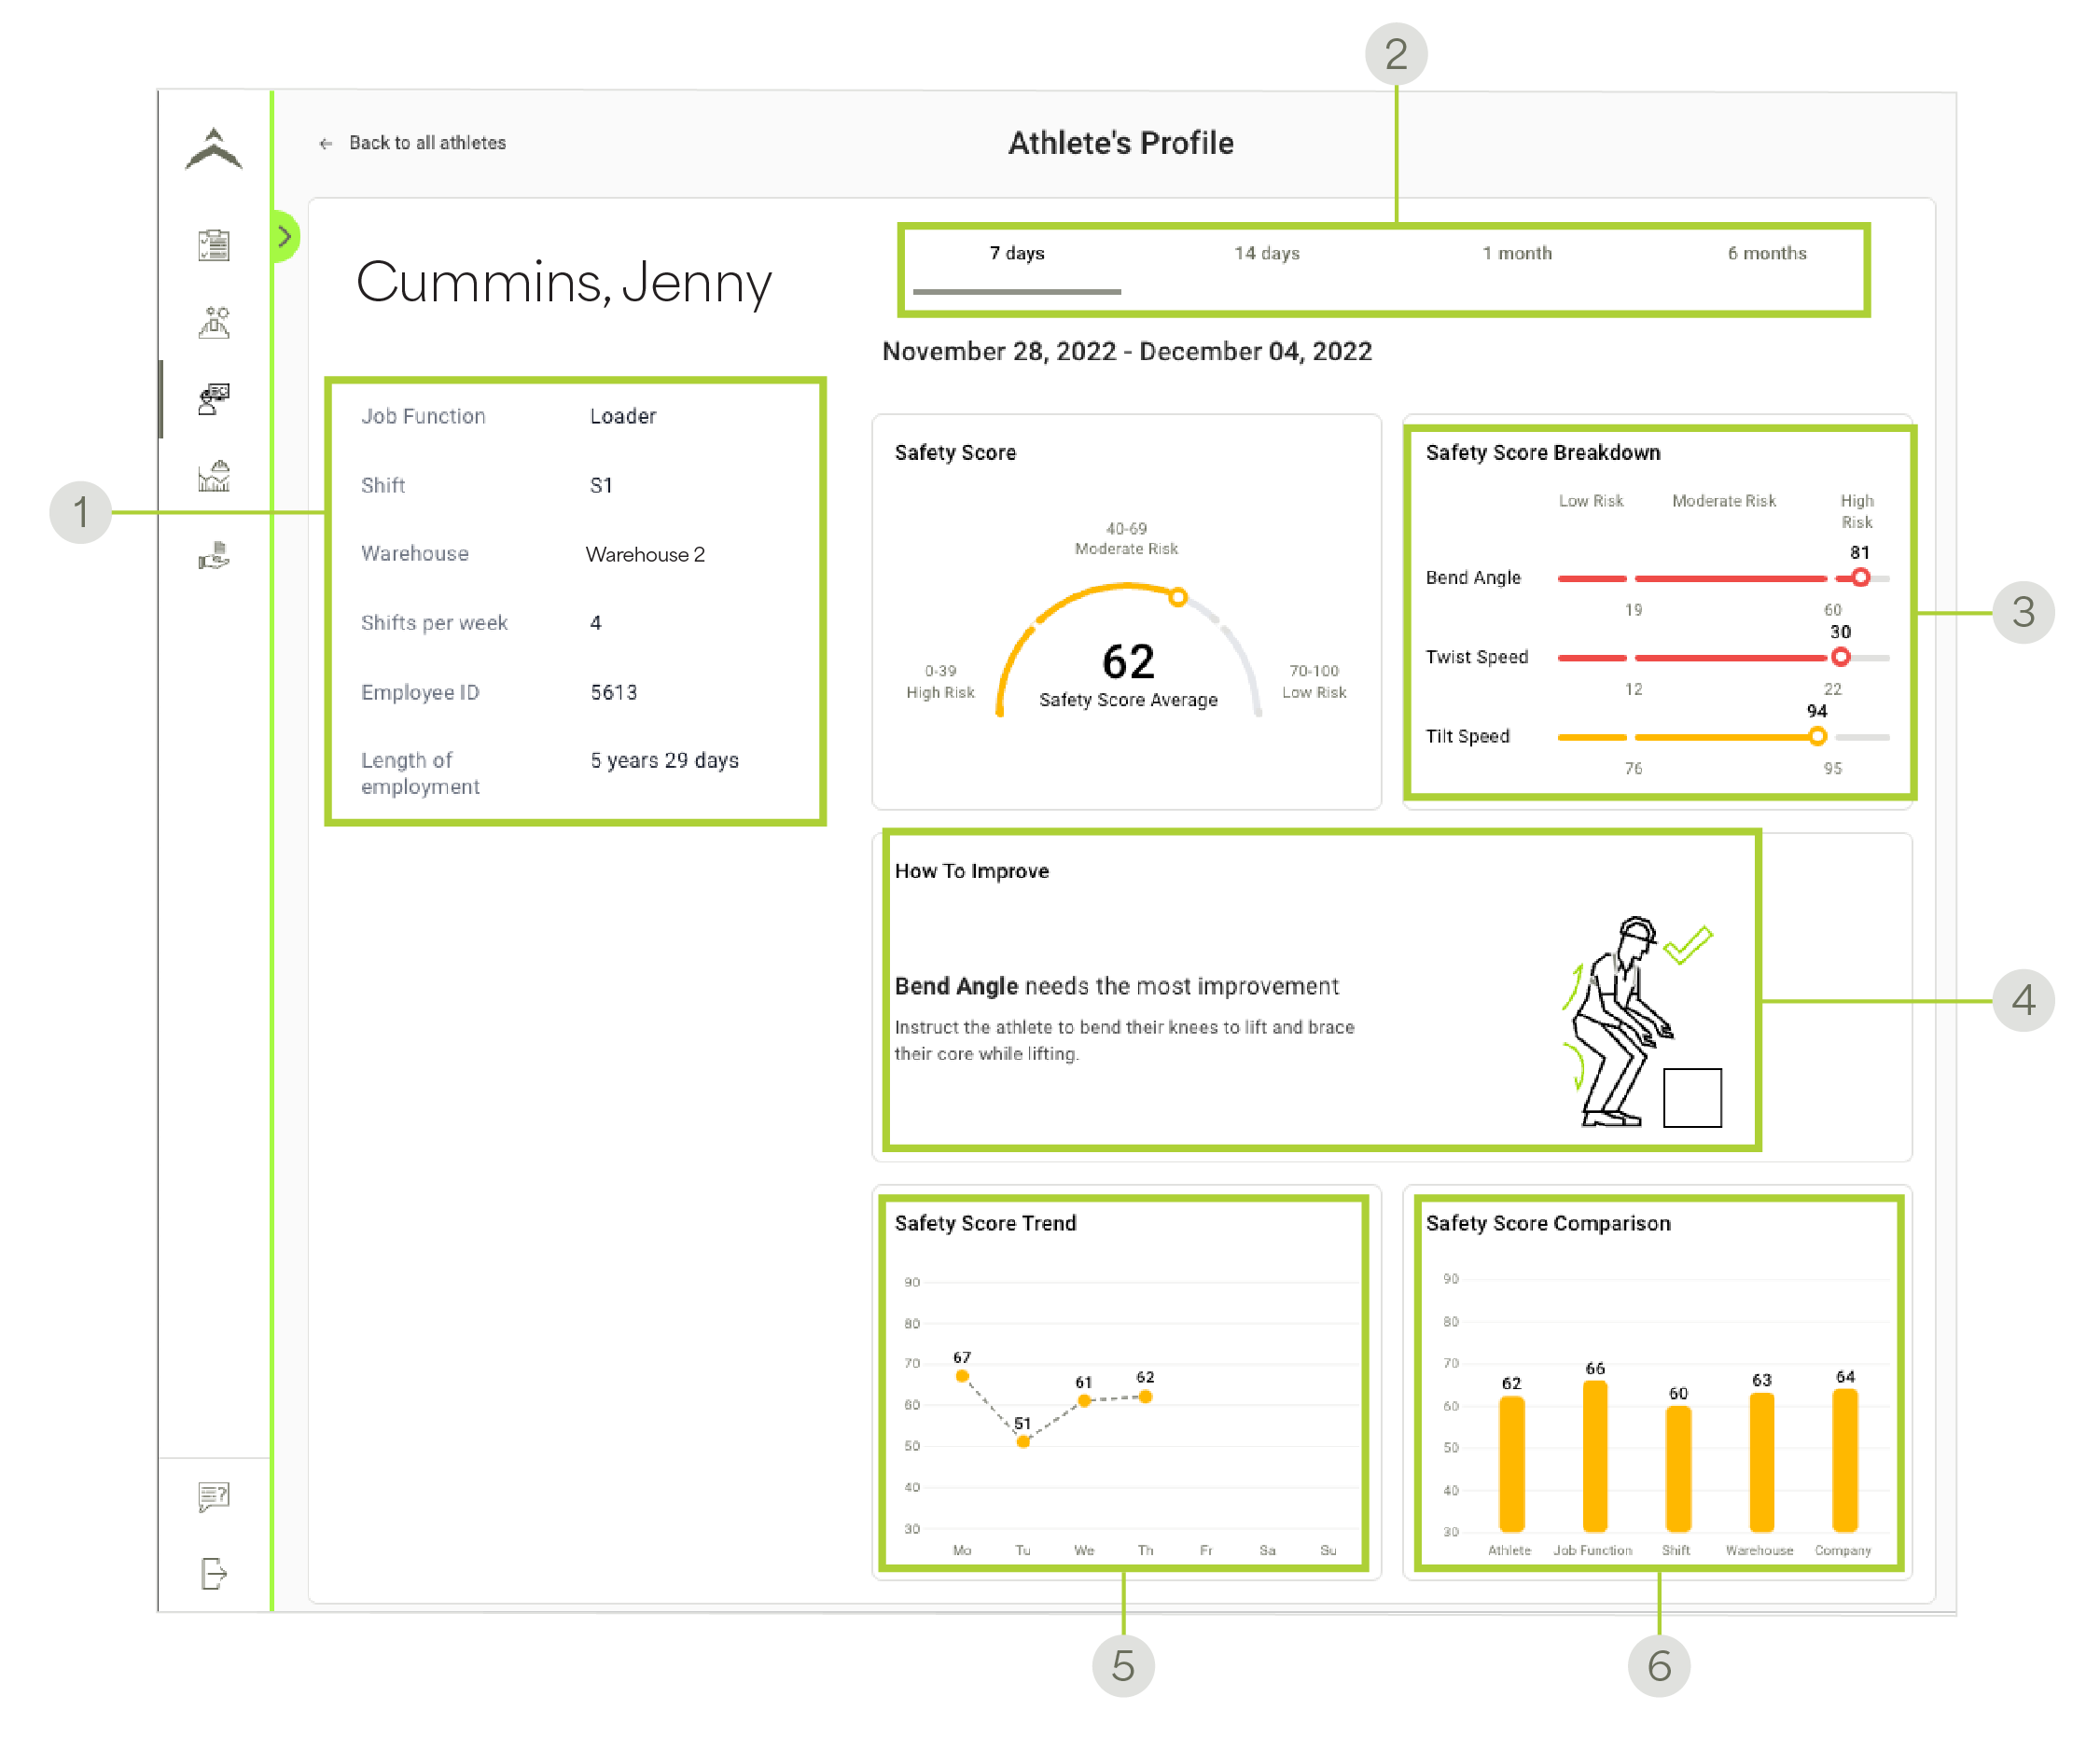
The Athlete Profile is designed to foster deeper connections with individuals on their safety data. The intuitive new view shows the Safety Score breakdown and provides guidance on the risk factor which can most positively impact their score. It also allows you to easily compare the individual to their peers by job function, shift, warehouse and company while visualizing their personal Safety Score Trend line. The tool is perfect to reference prior to a coaching opportunity or to take with you on the floor with a mobile phone or tablet to share directly with your Industrial Athletes.
Getting To The View
-
Open the Intervention App
Click the Intervention App icon from the sidebar navigation
-
Click On The Individual's Name
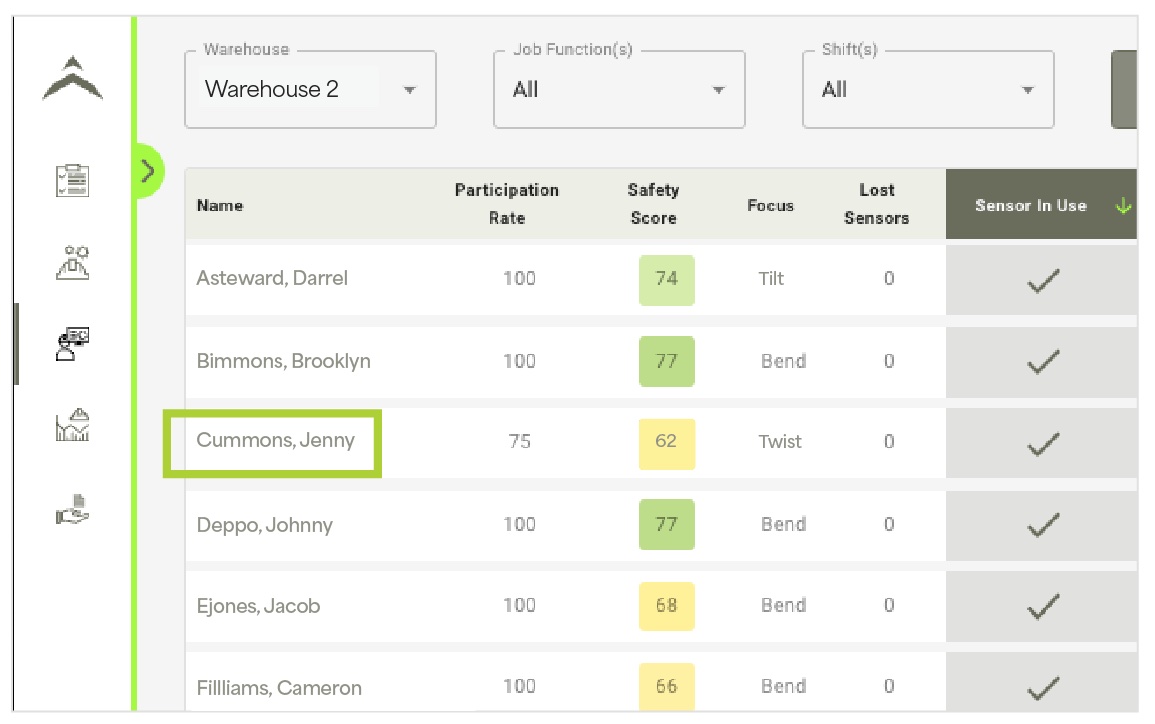
Figure 3. How To Connect With Your Athletes On Safety Data
-
Athlete Personal Details
View individual Athlete roster settings including primary job function, shift, warehouse, shifts per week, employee ID and tenure
-
Adjust Timeframe
Easily toggle between short term and long term data views
-
Safety Score Breakdown
Better understand how each of the 3 primary risk factor motions (bend, tilt and twist) are impacting the individual's Safety Score
*The lower the risk factor score, the safer the motion
-
Risk Factor Guidance
A coaching tip will be provided for the risk factor motion that will have the biggest positive impact on the individual's Safety Score
-
Trend Lines
Follow an individual's average Safety Score over time.
-
Safety Score Comparisons
Quickly see how an individual stacks up to their peers by job function, shift, warehouse or company.
Successful managers will work with the dashboard and individuals in a phased approach.
Phase 1
-
Use the report to focus on participation.
-
Monitor the team and individual check-outs daily, working to get more Industrial Athletes wearing the sensor on a regular basis.
-
Try to make wearing the sensor standard PPE and part of the daily routine.
Phase 2
-
Positively reinforce Industrial Athletes who are regularly wearing the sensor and working safely.
-
Look for Industrial Athletes who have shown improvement to their safety score over time or who have been on a streak of consistently safe days.
Phase 3
-
Identify Industrial Athletes who need feedback to improve their Safety Score.
-
What risk factor is driving their score down?
-
Engage with the IA to determine if environment or behaviors are impacting their score the most so you can help drive change.